
One clean number can hide two different denominators
Pelican Lake's 2024-25 creel report contains three numbers that look ready for division: 12,149 hours of directed musky effort, an estimated total catch of 450 muskellunge, and 35.4 hours per musky caught. Divide the first two and the answer is about 27, not 35.4.
Nothing is wrong with the report. The two catch measures answer different questions. Total catch includes muskellunge reported by all anglers, whether they were targeting muskies or caught one incidentally. The specific catch rate uses only trips by anglers who said they were targeting that species. The numerator and denominator belong to the same selected group.
That distinction is the whole article in miniature. A useful number is not just a value. It is a value attached to a population, a time period, and a method. Remove those attachments and the statistic becomes more confident than the evidence.
What the three reports actually observed
On Pelican Lake, Wisconsin DNR estimated 12,149 hours of directed musky effort and 450 muskellunge caught during the 2024-25 survey. The specific catch rate was 35.4 hours per musky. Musky effort peaked in July, while estimated catch peaked in August at 157 fish.
On the Tomahawk Lake Chain, the same 2024-25 reporting framework estimated 8,448 hours of directed musky effort, 372 muskellunge caught, and 45.6 targeting-angler hours per catch. Both the highest directed effort and the highest estimated catch occurred in August, with 2,138 hours and 88 fish.
Lac Vieux Desert's 2023-24 report estimated 18,945 hours of directed musky effort, 342 muskellunge caught, and 79.1 targeting-angler hours per catch. June held both its highest directed effort and highest catch, at 5,253 hours and 110 fish. None of the three reports documented an angler-harvested muskellunge during its survey.
How a clerk turns shoreline time into a lake estimate
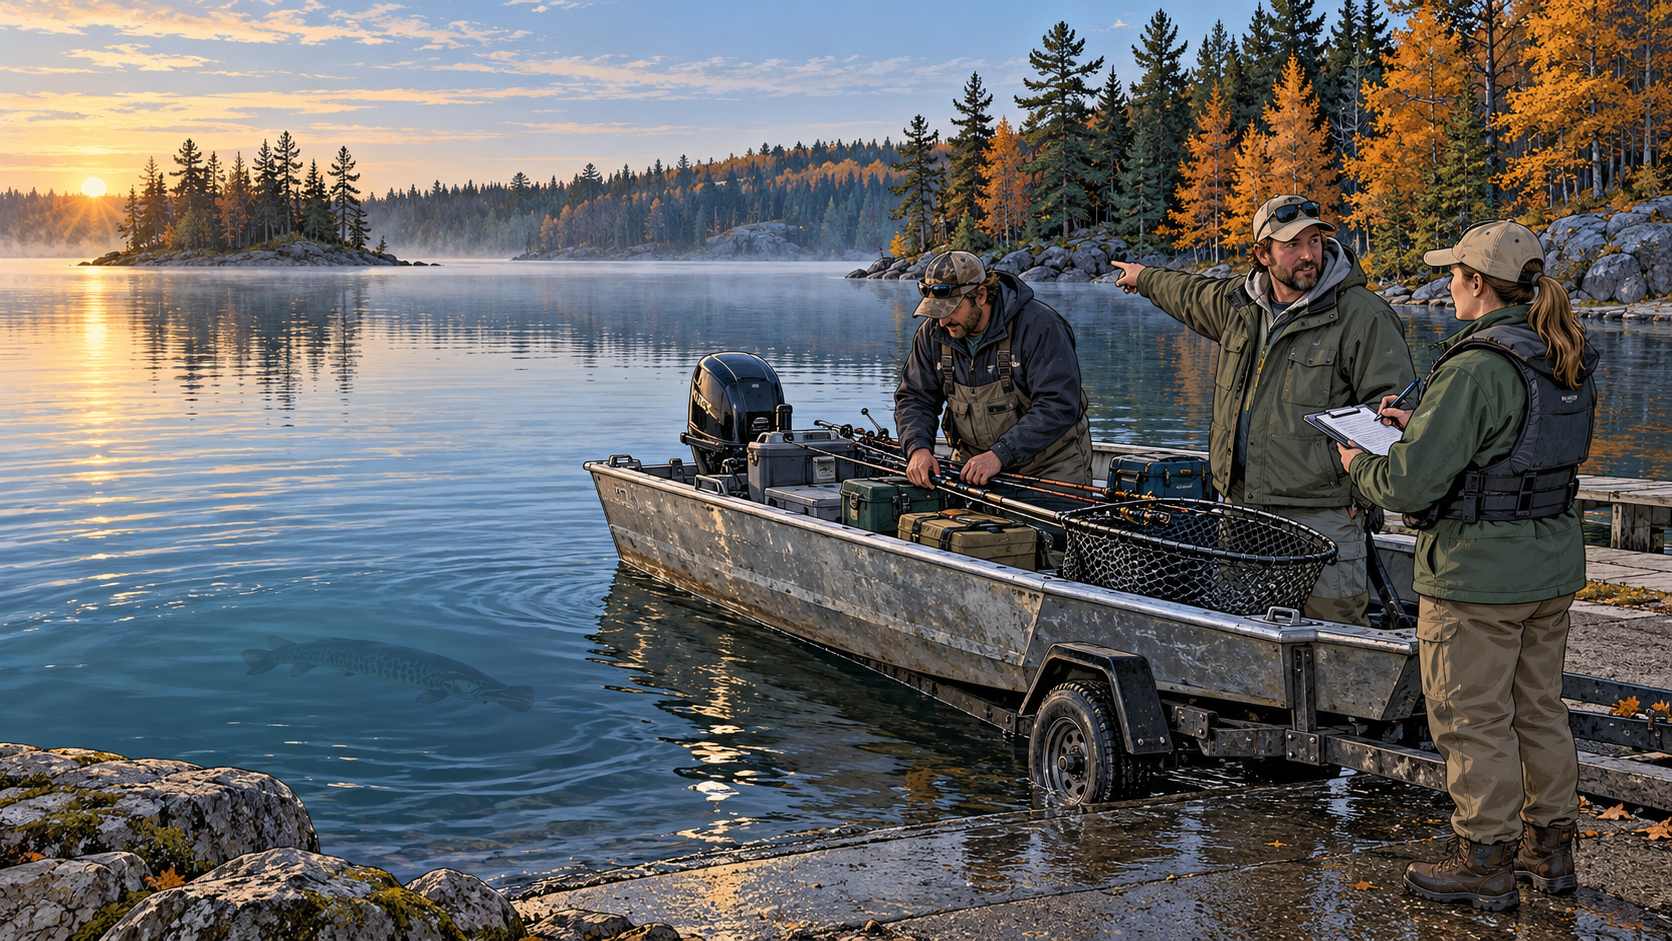
Wisconsin's report explains the machinery. A complete census of every fishing trip would be impractical, so creel clerks sample randomly selected days and shifts. They count anglers at predetermined times and interview people after completed trips about target species, catch, harvest, marked fish, fish lengths when applicable, and hours fished.
A computer program then estimates monthly and annual effort, catch, harvest, and rates from those samples. The DNR states plainly that the results are estimates based on the best available information, not a complete accounting. Accuracy depends on sampling enough representative activity and on anglers cooperating and answering truthfully.
The surveys were conducted during daylight hours through the open gamefish season and skipped November, when effort is low and ice conditions can be unsafe. That design is explicit and practical. It also means the published rate should not be treated as a direct census of every dark-hour or shoulder-season musky trip.
Why three waters do not make a league table
The three rates tempt a simple ranking: Pelican first, Tomahawk second, Lac Vieux Desert third. That is a fast reading and a poor one. Lac Vieux Desert was surveyed a year earlier, straddles the Wisconsin-Michigan boundary, and operated under a different calendar and regulatory setting. The waters differ in size, habitat, forage, angling pressure, travel patterns, and who chose to fish them.
Angler skill and strategy travel inside the number too. A water that attracts specialized local anglers can produce a different rate from one receiving more exploratory effort even if fish abundance were identical. Presentation choice, trolling versus casting, season selection, trip length, reporting, weather, and the share of incidental catches can all alter the observed result.
Hours per fish therefore does not measure population density. It does not measure trophy potential. It does not guarantee the next bite. It describes the estimated experience of a defined set of anglers during one survey design and period.
The number still matters
Rejecting a false ranking does not make the rate useless. Effort-normalized catch is more informative than catch alone because 100 muskies caught in 2,000 directed hours describes a different fishery from 100 caught in 20,000. Creel surveys also reveal when anglers concentrate effort and when estimated catches occur, information that a netting survey cannot supply on its own.
The most defensible comparisons usually stay close to the design. Compare the same water across repeated creel surveys while checking for changes in season, regulations, sampling, and angler behavior. Compare months inside one survey. Read catch rate beside total effort, total catch, harvest, habitat, and independent population surveys rather than asking it to replace them.
The zero documented harvest in all three reports is meaningful as a survey observation. It is not proof that no musky was harvested anywhere or that every released fish survived. The reports themselves distinguish an estimate from a complete accounting.
Build a personal rate that can survive comparison
An angler can borrow the survey's discipline. Record actual fishing minutes, not simply a day on the lake. Separate directed musky effort from time spent on other species. Decide whether the event is a follow, strike, hooked fish, netted fish, or released fish, and do not change that definition after the season begins.
Store lake, date, start and end time, month, water temperature when measured, wind, presentation family, casting or trolling, number of anglers, and whether the trip ended early. Keep blank effort. A catch-only log can calculate a flattering number, but it cannot calculate a rate.
Do not compare a full boat's hours with a solo angler's hours without choosing a convention. Boat-hours and angler-hours are not interchangeable. The Wisconsin creel reports use angler effort. A private log should name its unit just as clearly.
Test the matched-effort theory
The working theory is that part of a water's observed catch-efficiency signal will persist when future effort is matched more carefully. Build paired samples from comparable months, light windows, presentation families, and experience levels. Use the same contact definition and the same effort unit on every water.
The theory gains support if one water continues to produce a lower effort per defined contact across repeated matched samples. It loses support if the ranking disappears, reverses, or depends on one angler, one weather event, one lure family, or one unusually productive week.
This test cannot turn a personal log into a DNR creel survey. It can make the private conclusion smaller, clearer, and easier to disprove. That is enough to improve the next decision.
Keep the method attached
Hours per musky is an honest number when it carries its baggage: targeting anglers, sampled trips, a named season, a particular water, a declared unit, and uncertainty about the fishing that was not observed.
Use it to ask better questions. Why did catch peak after effort peaked? Did the same water change between surveys? Does a personal pattern survive when blank hours and boat size enter the record? Those questions respect what the statistic can do.
The scorecard version asks which lake won. The fisheries version asks what was measured. The second question gets you closer to the truth, and usually closer to a repeatable fishing decision.