
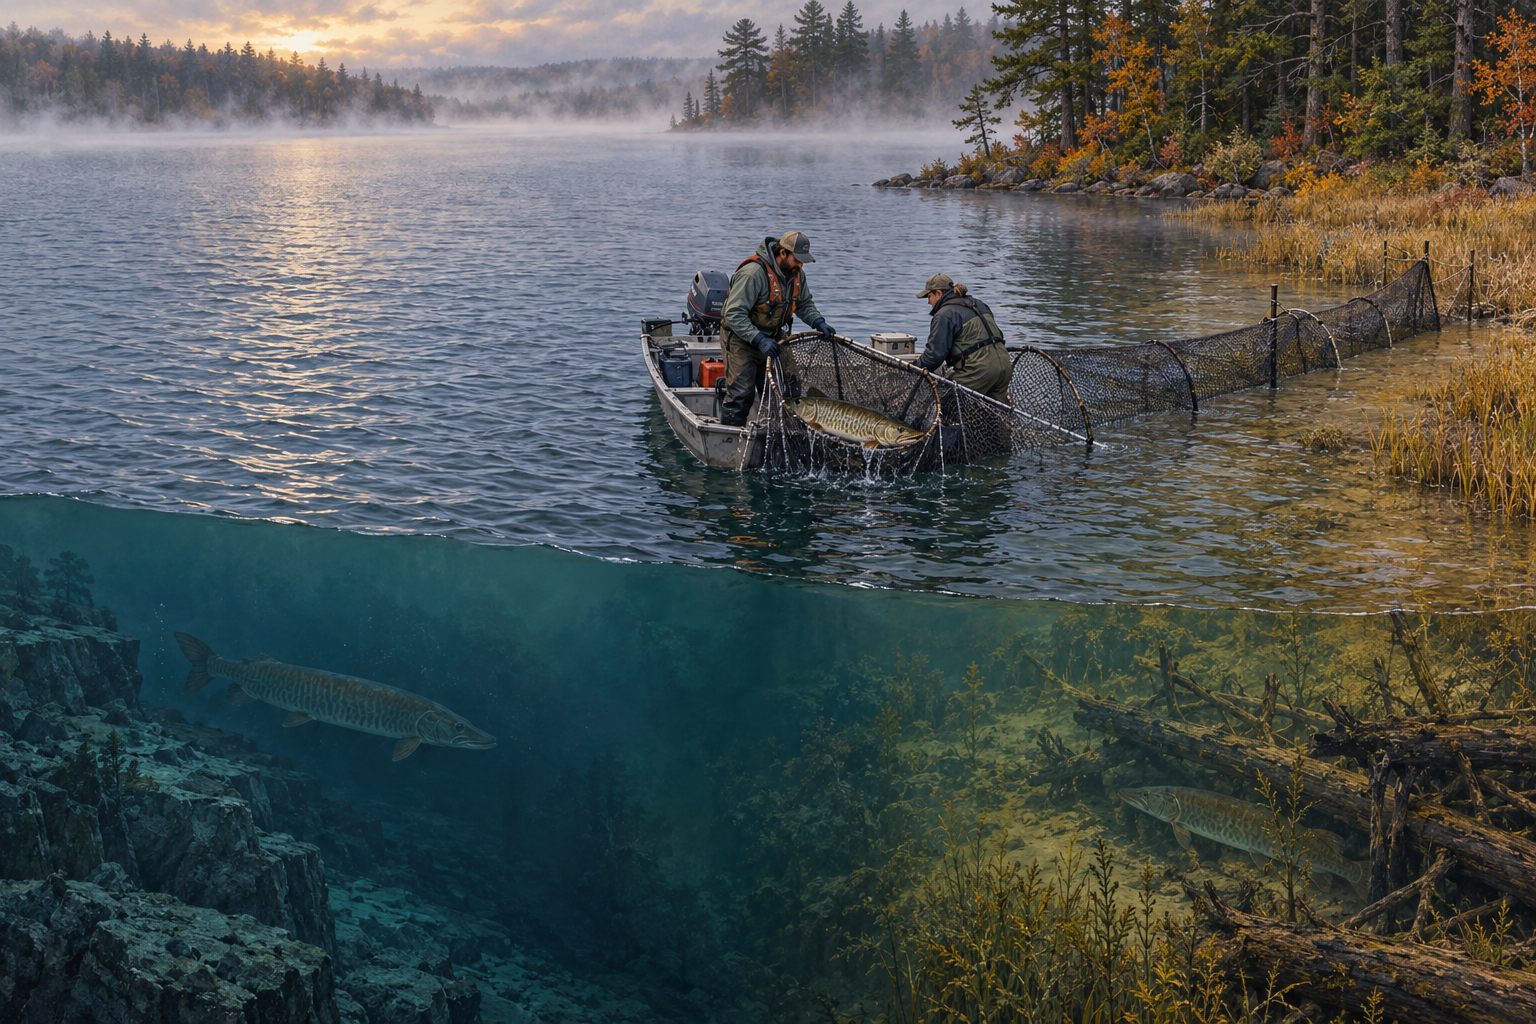
The fish in the net are not the fish in the lake
A survey photo can look definitive. There is a musky in the cradle, a PIT tag in the scanner, and a number on the datasheet. The encounter is real. The temptation is to treat every fish caught as a direct slice of the whole population.
That is not what a net can promise. A fyke net samples fish that move through its opening while it is set in a particular habitat during a particular season. An electrofishing boat samples another window. Hydroacoustics sees targets that occupy the water its beam reaches. Each method observes a population through a lens.
The useful work begins by keeping the observation and the estimate separate. Number captured is observed. Catch per net-night standardizes that catch by effort. Population abundance is modeled from encounters, recaptures, and assumptions. Those numbers answer related questions, but they are not interchangeable.
Mark, release, meet the population again
Wisconsin DNR's 2022-2023 Rice Lake survey shows the structure clearly. Biologists marked adult muskellunge during early spring netting, returned the next year, and used the mix of marked and unmarked adults in the recapture sample with a Chapman-modified Petersen estimator. The report defines the ingredients: fish marked in the first sample, all fish captured in the second sample, and marked fish found again.
The intuition is simple. If many fish in the second sample already carry marks, the marked group probably represents a substantial share of the population. If very few are marked, the unseen population may be larger. The actual calculation accounts for small-sample bias, and a complete report should pair the estimate with its uncertainty.
The method does not turn the lake into a jar of numbered marbles. Standard mark-recapture assumptions include a population that is sufficiently closed during the relevant interval, marks that remain recognizable, marked fish mixing with unmarked fish, and capture probabilities that the model can reasonably represent. The estimate is strongest when the design and the fish behave close enough to those assumptions.
The second year exists because fish remember the first
A Wisconsin DNR report for Long Lake explains why its musky population estimate uses two years: muskellunge can become net shy after a fyke-net encounter and may avoid the gear for the rest of that year. Returning in a later year gives the recapture sample time and distance from the marking event.
That detail changes how an angler should read a report. The survey schedule is not administrative lag. It is part of the biological design. A fish's response to capture can alter the probability of meeting the gear again, and that probability sits underneath the estimate.
Long Lake also incorporated PIT-tagging data from trained anglers to improve precision. That does not make angling and netting identical samples. It shows how additional detection paths can strengthen a study when managers know where each record came from.
Four recaptures can decide whether there is an estimate
In the Spirit Lakes, Wisconsin DNR tagged 34 muskellunge during 2024 spring netting. The report said a 2025 density estimate would require at least four tagged fish to be recaptured in each lake. Until then, the marking sample supported catch rates and size-structure descriptions, but not the planned population estimate.
This is the difference between missing data and a negative result. Too few recaptures do not prove low abundance. They may mean the survey could not estimate abundance with the required reliability. The honest output can be unknown.
The same report shows why effort belongs beside the catch. Earlier Spirit Lakes catches were high but came from little effort. The authors treated those results as suggestive rather than equivalent to a full, standardized survey. A dramatic catch rate can be useful evidence without carrying the weight of a population estimate.
Gear draws its own version of the lake
A Wisconsin study of yellow perch offers a clean warning about habitat and gear. Spring mark-recapture estimates were, on average, 4.0 to 8.5 times larger than summer hydroacoustic estimates. Researchers concluded that the spring method likely sampled the adult population more broadly while hydroacoustics emphasized a post-spawn pelagic component.
That magnitude belongs to yellow perch in the studied lakes, not to muskellunge. It should not be copied into a musky estimate. The transferable lesson is narrower: two competent methods can return different population pictures when they make different habitats and behaviors available for detection.
A musky survey therefore has to be read from the methods outward. Ask where the gear was placed, when it was active, what size fish counted as adults, how effort was standardized, and whether the comparison uses the same protocol. The lake did not change simply because the lens changed, but the visible part of it may have.
A missing tag is not a dead fish
A 2026 Ohio study followed 581 angler catch-and-release events involving 482 tagged muskellunge at Leesville Lake. Forty-five percent of the fish were later recaptured during monitoring that ran from 2016 through 2025. The study used future recapture as a proxy for apparent survival after release.
The word proxy matters. A fish can survive and never meet a reporting angler or survey net again. It can move beyond the sampled area, avoid the gear, lose or hide its tag signal, or remain present without being detected. Recapture can support survival inference, but nonrecapture is not a death certificate.
The Ohio analysis found no relationship between recapture probability and fish length or any tested temperature metric in that reservoir. Other studies have found warm-water effects elsewhere, so the authors did not turn the result into a universal rule. The location, design, detection process, and competing explanations travel with the conclusion.
Read every survey in five layers
First, identify the target. Was the report estimating adults at least 30 inches long, describing all captured fish, measuring size structure, or tracking survival? Second, find the gear and season. Third, record effort in net-nights, shoreline miles, hours, or another unit. Fourth, separate catch, catch per effort, and modeled abundance. Fifth, read the uncertainty and limitations before comparing the result with another water or year.
Comparisons are strongest when the target size, gear, timing, placement, and analysis stay similar. A change from 0.4 to 0.7 muskies per net-night may reflect the fishery, but it may also reflect different effort, weather, water level, spawning timing, net placement, or the availability of fish to the gear.
This does not make surveys weak. It makes them disciplined. A number with a documented method, repeatable effort, and visible uncertainty carries more information than a precise-looking count with no explanation of how it was produced.
Build a survey-lens ledger
Choose one water with repeated musky surveys and build a row for every sampling event. Store date, water temperature, water level, target size, gear, net locations, habitat sampled, number of net-nights, number captured, number marked, number recaptured, catch per effort, abundance estimate, confidence interval, and any note about movement or gear avoidance.
Add a field for what the method could not see well. For a shoreline net, that may be offshore fish. For a summer acoustic survey, it may be fish tight to complex cover. For angler reports, it may be unreported catches and uneven effort. Do not assign a correction unless the study supports one. Record the blind spot as a limit.
The theory gains support if method-matched results form a more coherent trend than raw catches pooled across gears and seasons. It loses support if raw catch counts predict independently estimated abundance just as well after effort, timing, habitat, and detection are considered.
A strong estimate still has edges
A fisheries estimate is not an admission that biologists do not know the answer. It is the scientific answer to a population that cannot be counted fish by fish. The estimate states what the data and design support, while the confidence interval and methods show where that support thins.
Anglers can use that information without pretending it predicts the next cast. Adult density describes a population-level state. It does not reveal today's fish position, feeding window, lure response, or the share of the population available to an angler.
The right question is not whether the survey counted every musky. It is whether the lens was appropriate, the effort was documented, the assumptions were examined, and the uncertainty stayed attached to the number.